A Complete Guide
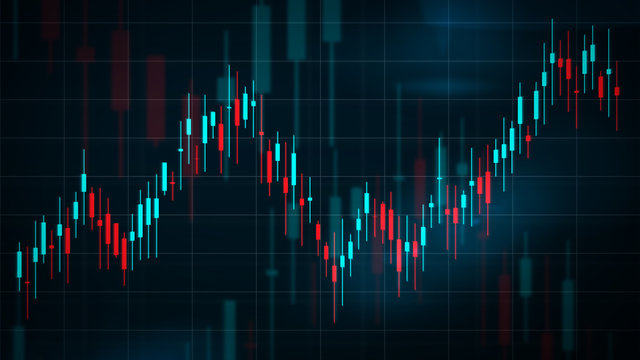
Candlesticks are a vital tool in technical analysis, and in this candlestick explainations, we will explore how they are widely used in financial markets to interpret price movements. They provide insights into market trends, reversals, and indecision points through a simple, visual format.
Key Takeaways
- Candlesticks represent price movements in a given time frame.
- Each candlestick has four components: open, high, low, and close prices.
- Candlestick patterns reveal trends and market psychology.
- They can signal reversals, continuations, or market indecision.
Understanding Candlesticks
What Are Candlesticks?
Candlesticks are graphical representations of price data for a specific time period, forming patterns used in market analysis.
- Each candlestick summarizes open, close, high, and low prices.
- The body shows the price range between the open and close.
- The wicks (shadows) show the high and low prices of the period.
Parts of a Candlestick
- Body:
- Large body = strong price movement.
- Small body = little movement or indecision.
- Wicks (Shadows):
- Upper wick = highest price reached.
- Lower wick = lowest price reached.
- Color:
- Green/White: Close price is higher than open (bullish).
- Red/Black: Close price is lower than open (bearish).
Common Candlestick Patterns
Bullish Patterns
- Hammer: Small body, long lower wick. Signals a potential reversal to the upside.
- Bullish Engulfing: A smaller red candle is followed by a larger green candle, engulfing the previous body.
- Morning Star: Three-candle pattern signaling a bullish reversal.
Bearish Patterns
- Shooting Star: Small body, long upper wick. Signals a potential downside reversal.
- Bearish Engulfing: A smaller green candle followed by a larger red one.
- Evening Star: Indicates a bearish reversal, opposite of the morning star.
Indecision Patterns
- Doji: The open and close are almost equal, signaling market indecision.
- Spinning Top: Small body with long wicks, showing balance between buyers and sellers.

How to Use Candlesticks in Trading
- Identify Trends:
- Bullish trend: Predominantly green candles.
- Bearish trend: Predominantly red candles.
- Recognize Patterns:
- Look for formations like hammers, engulfing patterns, or stars.
- Confirm Signals:
- Use candlestick patterns with other indicators (e.g., RSI, MACD).
Advantages of Candlestick Charts
- Easy to interpret.
- Helps visualize market sentiment.
- Effective in identifying potential reversals or continuation patterns.
FAQs
What makes candlestick charts unique?
Candlestick charts offer a more visually intuitive way to analyze market data compared to line or bar charts.
How reliable are candlestick patterns?
While candlestick patterns are powerful, they work best when combined with other technical indicators and a solid risk management strategy.
What time frames work best for candlestick analysis?
They work on all time frames, from 1-minute charts to monthly charts, depending on your trading style